Guest expectations in hospitality have shifted dramatically. As travelers face higher room rates and stricter travel budgets, their scrutiny of cleanliness, service speed, and amenities has intensified.
Understanding macro industry benchmarks is essential for hotel asset owners, General Managers, and revenue directors. When evaluating guest feedback data across 11,200 hotels, 11.5 million reviews, and 34 million sentiment mentions globally, clear patterns emerge regarding what drives 5-star praise versus what triggers damaging 1-star detractors.
In this benchmark report, we break down:
- Global review volume and rating momentum across star tiers.
- Department-by-department sentiment impacts (Housekeeping, F&B, Staff, Sleep Quality).
- Star-category divergence: Why 3-star and 5-star guests complain about entirely different issues.
- The review response lag crisis (and why a 2.5-day turnaround is too slow in 2026).
- Regional differences across Europe, North America, Asia-Pacific, and Latin America.
- How to translate macro benchmarks into daily operational improvements.
Macro Trends: Review Volume and Rating Momentum
Globally, guest review volume expanded by 2.6% year-over-year, driven by strong international travel demand in Asia-Pacific and Southern Europe. At the same time, the Online Travel Agency (OTA) landscape underwent notable consolidation:
Expedia & Hotels.com Dataset Integration: The consolidation of Hotels.com verified reviews into Expedia’s global review architecture created a unified guest sentiment stream, increasing the weight of Expedia ratings in overall reputation scoring.
Google Maps Dominance: Google Maps solidified its position as the fastest-growing source of public hotel reviews, accounting for more than 62% of total review volume in key urban markets.
Star-Tier Rating Lift: Overall reputation indices increased modestly across 3-, 4-, and 5-star categories, reflecting post-pandemic investments in staff training and digital check-in systems.
Star-Category Benchmark Comparison: 3-Star vs. 4-Star vs. 5-Star Properties
Guest satisfaction is not uniform across hotel tiers. Travelers calibrate their expectations based on Average Daily Rate (ADR) and star category:
| Hotel Star Tier | Primary Satisfaction Driver | Primary Detractor Trigger | Avg. Review Response SLA | Critical Coverage (1–3★) |
|---|---|---|---|---|
| 3-Star Hotels | Convenient location, functional Wi-Fi, friendly front desk | Bathroom cleanliness, dated decor, street noise | 4.8 days | 38% responded |
| 4-Star Hotels | Comfortable bedding, breakfast variety, luggage handling | Check-in queues, lukewarm buffet food, AC inconsistency | 3.2 days | 56% responded |
| 5-Star Luxury | Anticipatory service, concierge expertise, signature amenities | Service friction, delayed room service, minor maintenance defects | 2.5 days | 78% responded |
Department Analysis: What Moves the Needle in Guest Reviews?
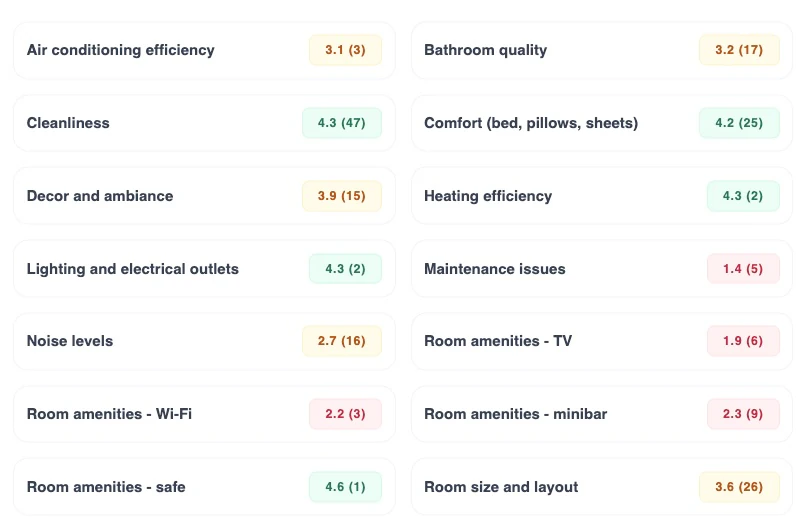
Evaluating millions of review sentences using aspect-level sentiment NLP reveals clear departmental hierarchies:
1. Staff & Service Quality: The Universal Positive Anchor
Across all seven global regions and every hotel class, staff friendliness and helpfulness is the single greatest positive driver of review scores. When a guest review praises a specific employee by name, the probability of a 5-star rating exceeds 84%.
Key Insight: Guests will forgive minor physical shortcomings (such as small rooms or older elevators) if the front desk and concierge treat them with warmth, empathy, and speed.
2. Cleanliness: The Instant 1-Star Penalty
While great service earns 5 stars, cleanliness failures are the fastest route to a 1-star review. In 3-star and mid-tier accommodations, bathroom cleanliness, hair on linens, and musty odors accounted for over 45% of all 1-star reviews.
The Cleanliness Cliff: A hotel that slips below 88% cleanliness sentiment experiences a 0.4 drop in overall OTA score within 60 days.
Actionable Fix: Implementing photo-verified housekeeping inspection checklists prevents dirty room allocations before guests receive their keys.
3. Food & Beverage: The Value-for-Money Test
Dining sentiment exhibited slight declines in overall satisfaction, particularly regarding breakfast operations:
Coffee Queues: Long waits for espresso machines during the 8:30–9:30 AM breakfast rush generate frequent negative mentions.
Buffet Temperature: Lukewarm eggs and un-replenished pastry trays create immediate dissatisfaction among guests paying €15–€30 per breakfast.
The Opportunity: Adding a second coffee station or offering made-to-order eggs eliminates over 60% of breakfast-related complaints (see our Breakfast Cliff Study).
4. Room Comfort & Noise: The Sleep Disruption Penalty
Sleep disruption from street traffic, mechanical elevator hums, or rattling air conditioning units is catastrophic for guest ratings. Our empirical research across 17,963 reviews shows that a sleep disruption mention increases the odds of a 1-star rating by 24.5× (see our Silent Night Penalty Study).
The Review Response Crisis: Why 2.5 Days is No Longer Fast Enough
The benchmark data highlights a critical operational vulnerability: response turnaround time.
While 5-star luxury hotels lead the industry with an average response time of 2.5 days, mid-tier 3-star and 4-star properties take 3.2 to 4.8 days to reply. Worse, more than 44% of negative reviews at mid-tier hotels receive no management response whatsoever.
Hotels that implement an AI review response copilot reduce turnaround time from 2.5 days to under 4 hours, ensuring 100% critical review coverage with verified managerial oversight.
Regional Performance Variations
Reputation dynamics diverge across global territories:
North America: Leads in review volume and OTA booking penetration. Front desk efficiency and parking availability dominate guest critiques.
Europe: Characterized by older historic buildings. Air conditioning, elevator dimensions, and soundproofing are primary negative triggers, while historic charm and breakfast quality anchor positive sentiment.
Asia-Pacific: Records the highest overall service satisfaction scores globally. Guests reward anticipatory hospitality and express check-in technology.
Latin America & Africa: Fast-growing review volume, but infrastructure consistency (hot water pressure, Wi-Fi stability) drives rating volatility.
Traveler Segmentation: Who Complains About What?
Breaking down reviews by traveler segment reveals distinct expectations:
| Traveler Persona | Top Priority | Common Friction Trigger | Average Score Volatility |
|---|---|---|---|
| Business Travelers | Fast Wi-Fi, quiet sleep, prompt invoicing, early breakfast | Weak internet, noisy hallway footsteps, slow checkout | Low (highly predictable ratings) |
| Couples & Leisure | Ambiance, comfortable bed, balcony/view, dining quality | Twin beds pushed together, street noise, impersonal staff | Moderate (sensitive to romantic touches) |
| Families & Groups | Room space, connecting doors, pool facilities, breakfast options | Cramped rooms, extra cot fees, pool cleanliness | High (sensitive to amenity pricing) |
Why Legacy Annual Indexes (GRI) Need Real-Time Operational Telemetry
While global benchmark reports like ReviewPro's GRI are useful for multi-year portfolio valuation and board meetings, they suffer from a fundamental operational flaw: latency.
An annual or quarterly average looks backward at what occurred months ago. If your new executive chef improved breakfast quality last week, an annual index will not reflect that improvement for months. Conversely, if housekeeping standards slipped during peak season, an annual score hides the fire until ratings have already dropped.
That is why progressive hotel operators combine macro benchmarks with real-time operational telemetry like Hotel RPS (Review Performance Score). By tracking guest sentiment across a rolling 30-day window, managers isolate department issues immediately and resolve them before they impact quarterly RevPAR.
5 Actionable Takeaways for Hotel General Managers
Enforce a 24-Hour Critical Response SLA: Stop letting 1- to 3-star reviews sit unanswered for 3–5 days. Aim for 100% response coverage on negative feedback within 24 to 48 hours.
Celebrate Named Staff in Reviews: Front desk and housekeeping service is your #1 reputation asset. Recognize employees mentioned by name during morning briefings to motivate consistent hospitality excellence.
Audit the Breakfast Bottlenecks: If your property experiences negative F&B remarks, look at coffee machine queues and buffet refill speed between 8:30 and 9:30 AM.
Protect Nighttime Sleep Quality: Equip housekeeping and maintenance teams with decibel testing and soundproofing door seals to prevent catastrophic sleep disruption penalties.
Segment Feedback by Department: Stop looking at single overall star averages. Break feedback down into Housekeeping, F&B, Front Desk, and Facilities to assign specific accountability to department heads.
Conclusion: Moving from Passive Benchmarks to Proactive Action
Global guest experience benchmarks prove that hotel reputation is not an accident of luck or guest mood. It is the direct consequence of operational rigor, staff warmth, and rapid review engagement.
By understanding where guest friction concentrates and monitoring sentiment in real time, independent and boutique hotels can outperform corporate chains, win guest loyalty, and drive direct booking revenue.
📊 Want to see how your hotel compares to global benchmarks?
Get an instant evaluation of your property's departmental sentiment scores and review reply health: 👉 Claim Your Free Reputation Audit or explore our Hotel Reputation Intelligence Platform.